
Sensor Management Plans
It’s important to consider many different factors when making irrigation decisions. We recently rolled out a new feature that will help you decide if, when, and how much to irrigate: Sensor Management Plans.
Sensor Management Plans (SMP) let you customize the way you interpret your sensor station data throughout the growing season. As your crop develops, you can account for changing root depths or different crop growth stages that may require more or less water.
Sensor Station Indicators
By default, each sensor station on the Trellis Dashboard has an indicator with a color and a number (see Figure 1). The color tells you whether the most recent soil moisture reading is wet (blue), ok (green), or dry (gold). The number is an average of the most recent readings from each sensor along the moisture probe.

Figure 1. Each sensor station’s indicator (see red circle) consists of a color and a number.
For example, see Figure 2. This cotton sensor station has sensors at two different depths: 6” and 14”. The most recent readings collected by the two sensors are:
6” sensor: -9.3 kPa
14” sensor: -12.6 kPa

Figure 2. The most recent soil moisture readings for this cotton sensor station are -9.3 kPa and -12.6 kPa at sensor depths of 6” and 14”, respectively.
The average of the two most recent sensor readings is: (-9.3 + -12.6) / 2 = -10.95 or -11 kPa
According to the soil texture selected, the Wet / OK threshold is -11.5 kPa, so the indicator color is blue, as shown in Figure 2.
sensor weighting
As the crop develops, certain depths in the soil profile inevitably become more or less meaningful for irrigation management. Dr. Wes Porter, an Assistant Professor & Extension Precision Ag & Irrigation Specialist at UGA, recommends weighting your sensor readings differently over the course of the growing season (D1 = shallow sensor, D2 = middle sensor, D3 = deepest sensor)
Early Season: 80% for D1, 20% for D2, 0% for D3
Early-Mid Season: 60% for D1, 30% for D2, 10% for D3
Mid Season: 50% for D1, 25% for D2, 25% for D3
Late Season: 40% for D1, 30% for D2, 30% for D3
indicators with management plans
So, how would the indicators change if you had a Management Plan, compared to not having one?
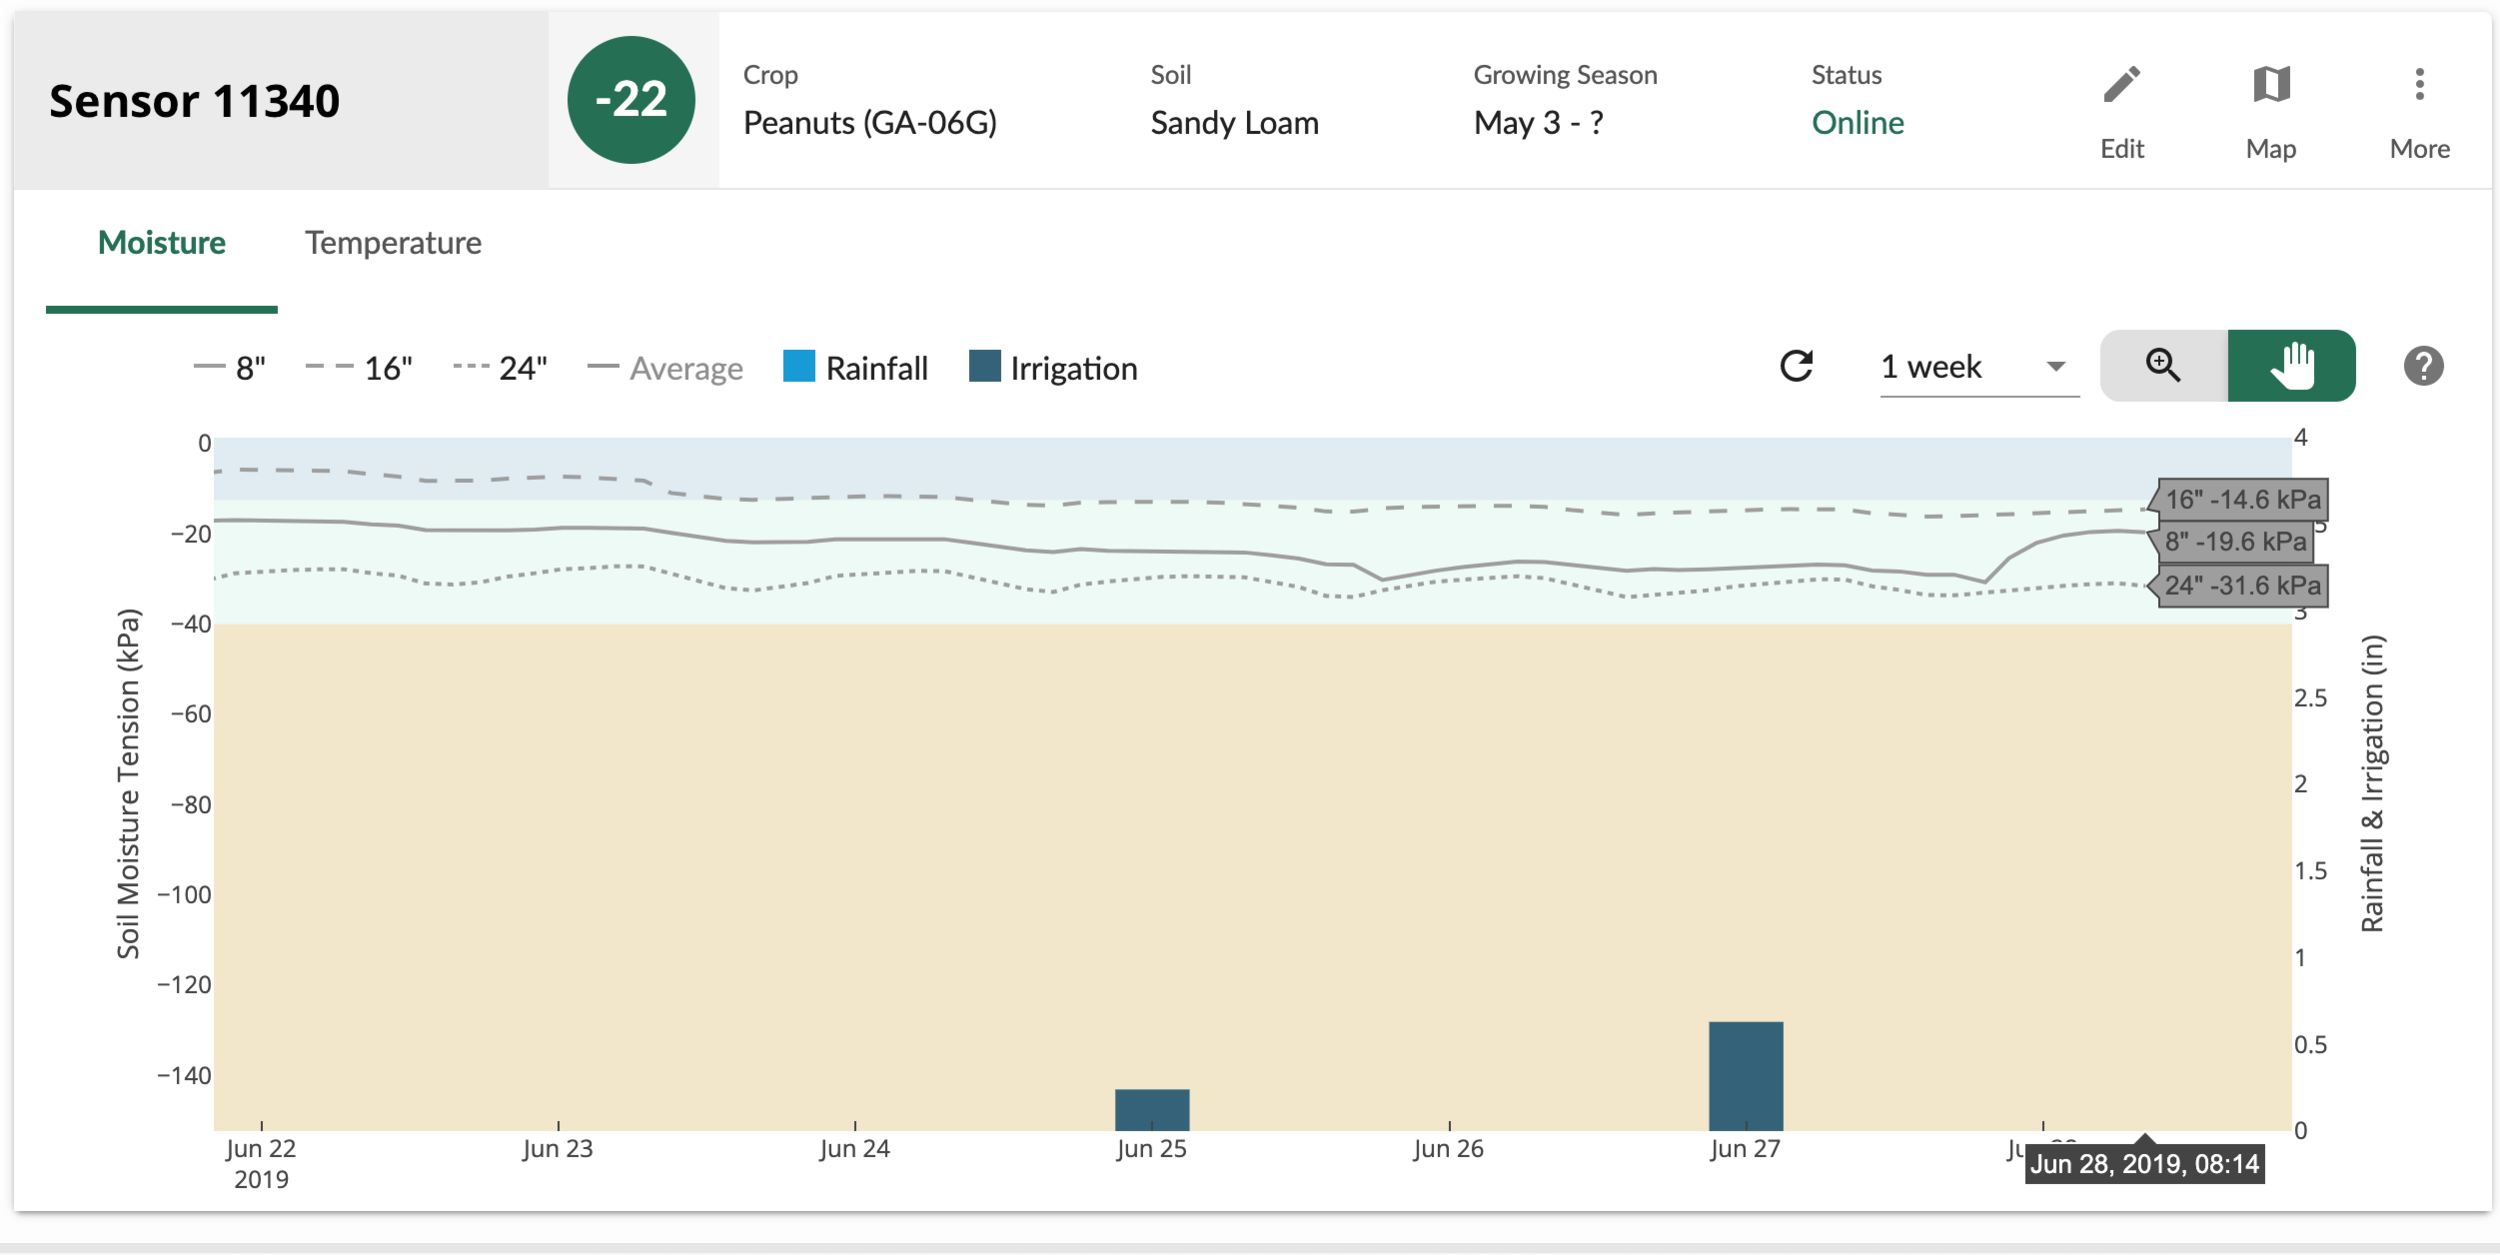
Figure 3. 3 Depth Soil Moisture Sensor Chart.
Look at the most recent readings from a soil moisture probe with sensors at 8”, 16”, and 24” in Figure 3. Without a Management Plan, we calculate the sensor indicator (in this case, -22 kPa) as a direct average of the sensor readings (see Figure 4).
What about if you use a Sensor Management Plan? Let’s say you just planted your field and are again using a probe with sensors at 8”, 16”, and 24”. Given that you just planted, soil moisture readings at 24” matter less than the other readings when scheduling irrigation. Let’s follow Dr. Porter’s recommendation to apply an 80% weight to the 8” sensor, a 20% weight to the 16” sensor, and a 0% weight to the 24” sensor.
In this case, the new indicator is -19 kPa (see Figure 5). What does this mean? You might be able to hold off irrigating a little longer. The soil moisture indicator will still be green, but the indicator is “more wet” than the original indicator.
how to add a plan
Follow the steps below to add a Sensor Management Plan!
Step 1: Select a field, then a sensor
Select one of your fields. Then, select one of your sensors.
Step 2: Edit your sensor
Click / tap the edit button (see pencil icon outlined in red below).
Step 3: Add a Sensor Management Plan
Select the Management Plan dropdown:
Select Add new plan and begin choosing the preferences you would like to implement into your sensor.
Step 4: Enter preferences
Stage Name: Provide a name for the stage. You can have multiple stages throughout the growing season.
Management Plans are divided into stages that determine how you’ll interpret your data over a fixed period of time. Oftentimes, these stages correlate to crop growth stages where you may want to manage soil moisture differently.
Days after planting: Days After Planting determines when this stage will take effect. The first stage must begin at day 0.
Moisture thresholds: You may wish to adjust your Wet & Dry Thresholds at different points in the growing season for optimal production. The default values you see here are based on the soil texture the sensor was installed in.
Sensor Depth Weights: Use the sliders to control the weightings for each depth. The weightings will automatically adjust to sum to 100%.
Step 5: Add more stages
Add more stages, as you wish. If you don’t add additional stages, the sensor weightings you enter in your first stage will be used throughout the rest of the season.
Step 6: Name the plan
Name the plan you created & click Save Plan to save and apply your changes.