

Why aren't my sensors responding?
Farmers and consultants call, text, and email us every day to assist them in viewing their sensors. It is important that our users know how to interpret the graphs from the dashboard or our mobile app. The Fields page allows users to see an overview of each field, and whether the weighted average of the sensors in the field are wet, ok, or dry, based on the soil texture, crop type, and recorded readings.

But the devil is in the details, right? How do you make sense of the soil moisture charts and use them to make decisions?
“I see my sensors ‘stair-stepping’ daily – what is that all about?”
The daily moisture and nutrient needs of the plant will often bring the readings down as the plant is working hard to extract water from the soil. This is then followed by a nightly “leveling off” which often makes the graph have a stair-stepping effect.
This is normal and expected! It’s actually a great way to tell where your roots are:
Lines on your chart will not stair-step if there aren’t any roots at that depth.
“We just had a heavy rain yesterday, why are my sensors not responding?”
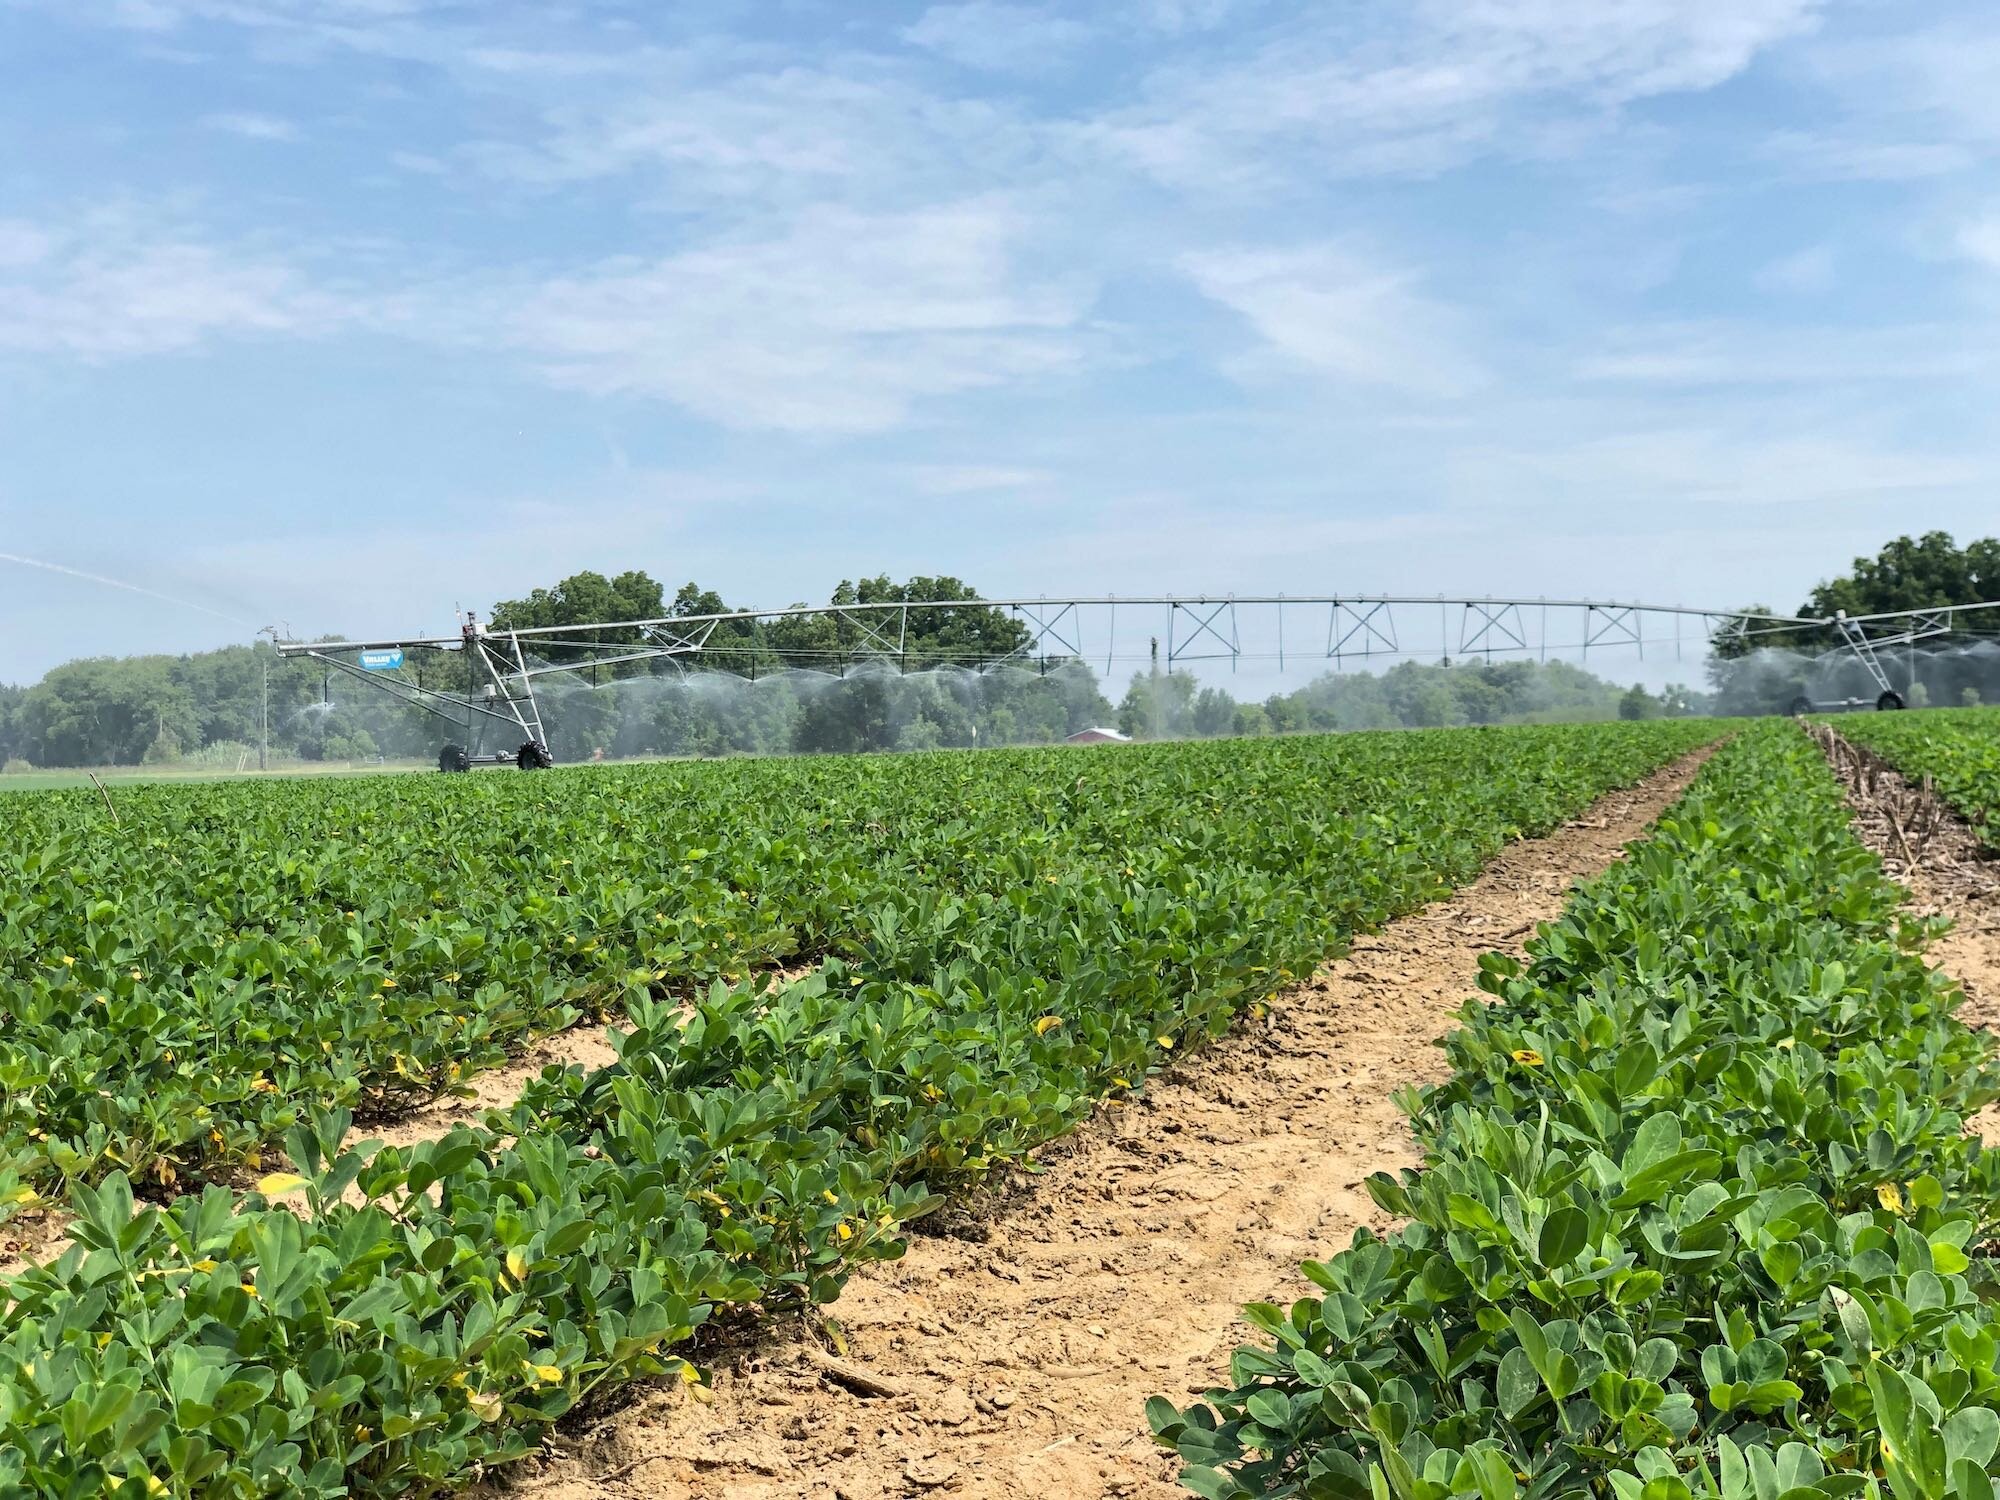
Check out the chart below. After each rain or irrigation events, you’ll see a spike in the soil moisture readings.

After heavy irrigation or precipitation, farmers immediately check their Trellis Dashboard expecting a significant spike in soil moisture content like we saw in the chart above. But sometimes, the chart might only show a moderate response, if any. In these scenarios, farmers often contact us because they are worried about the accuracy of their soil moisture sensors.

The chart is a prime example. The rain event on May 11 and the irrigation event on May 13 had little to no effect on the soil moisture chart; the soil was already wet.

For the chart above, we see little to no movement on the sensors after an irrigation event. When this happens, it is usually just a matter of having a thirsty crop on top and the water is not penetrating the soil because the plant absorbs it first.
What impacts my soil moisture readings?
To take this a bit further, we need to understand soil infiltration rates and application rates, and how they impact the soil moisture content that your sensors measure.
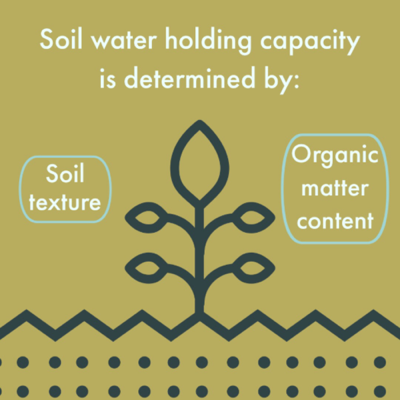
Current Moisture Content —The current moisture content is largely dependent upon the infiltration rate and water holding capacity. Water holding capacity is the amount of water a soil can hold, measured in inches of water per foot of soil.
The amount of water your soil can hold depends on the soil texture.
Soils with high water holding capacities sustain plant growth by retaining nutrients and pesticides better than those with low holding capacities.

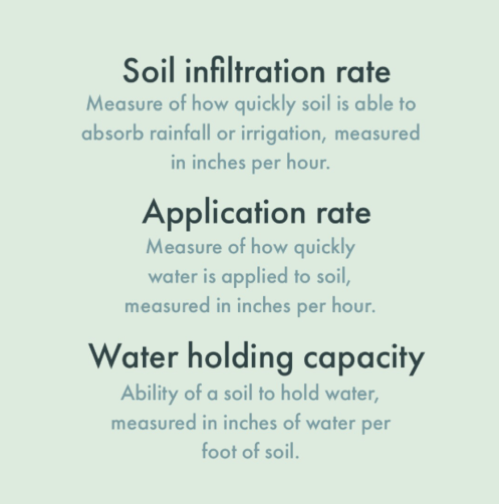
Soil Infiltration Rate – A measure of how quickly soil is able to absorb rainfall or irrigation measured in inches per hour. The table on the right lists average infiltration rates for various soil textures. Soil infiltration rates change based on how wet the soil is prior to precipitation or irrigation. If the soil is already saturated, its infiltration rate will be lower than the rate shown in the table, regardless of the soil texture.
Application rate – A measure of how quickly water is applied to soil, measured in inches per hour. Sometimes water reaches our crop in a natural, yet unpredictable way (rain). If we have 2.5 inches of rain in two hours, our application rate would be 1.25 inches/hour.
Water Holding Capacity — Soils can only absorb so much water per hour. If your application rate is higher than your infiltration rate, the extra water is lost to runoff, evaporation, and transpiration. In most cases it is far better for the crop, soil health, and your bottom line to apply less water more frequently if you can.
“I only put on a small amount of irrigation, why would my 36” sensors be responding?”
All of the above apply here, in terms of soil infiltration rate, application rate, and water holding capacity. It is also important to keep in mind the type of measurement we are taking. Soil water status can be expressed in two different ways: soil water content and soil water potential.
Sentek sensors (or other capacitance-based sensors) indicate the amount of water present in the soil profile.
Watermark sensors indicate the soil water potential (this is the sum of gravitational, osmotic, and matric potential). In lay terms, Watermark sensors measure how hard the plant has to work to extract water.
As you can see from the graph, as clay content increases, soil water retention increases. Sandy soil has large pores. Once these pores are emptied, very little water remains.
“Bottom Line: If you apply more water than your soil can absorb in a given amount of time, you are losing money and wasting water"
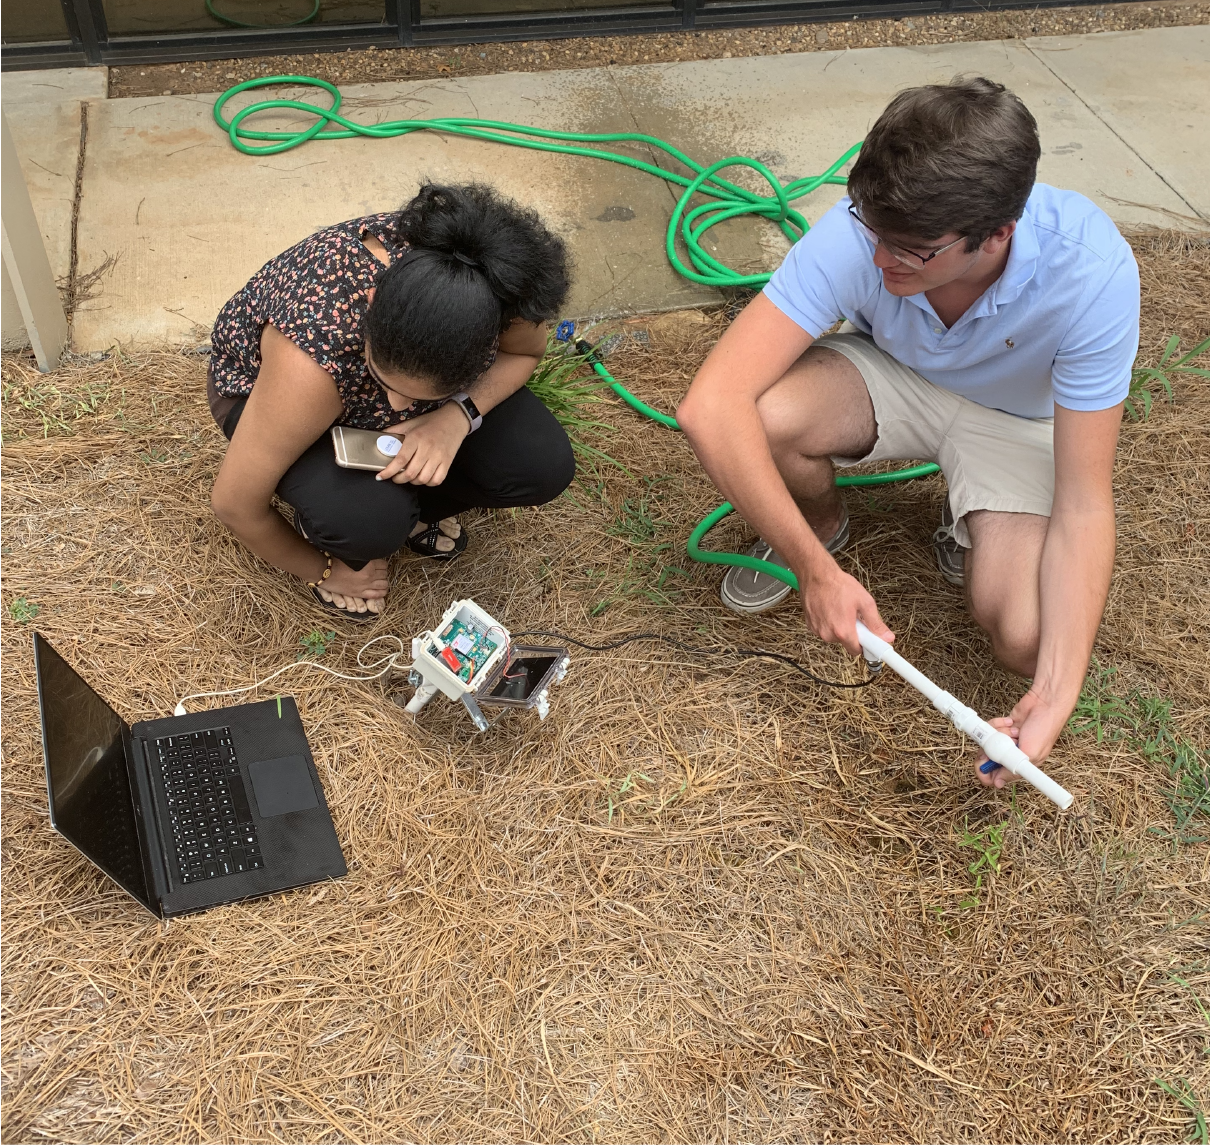
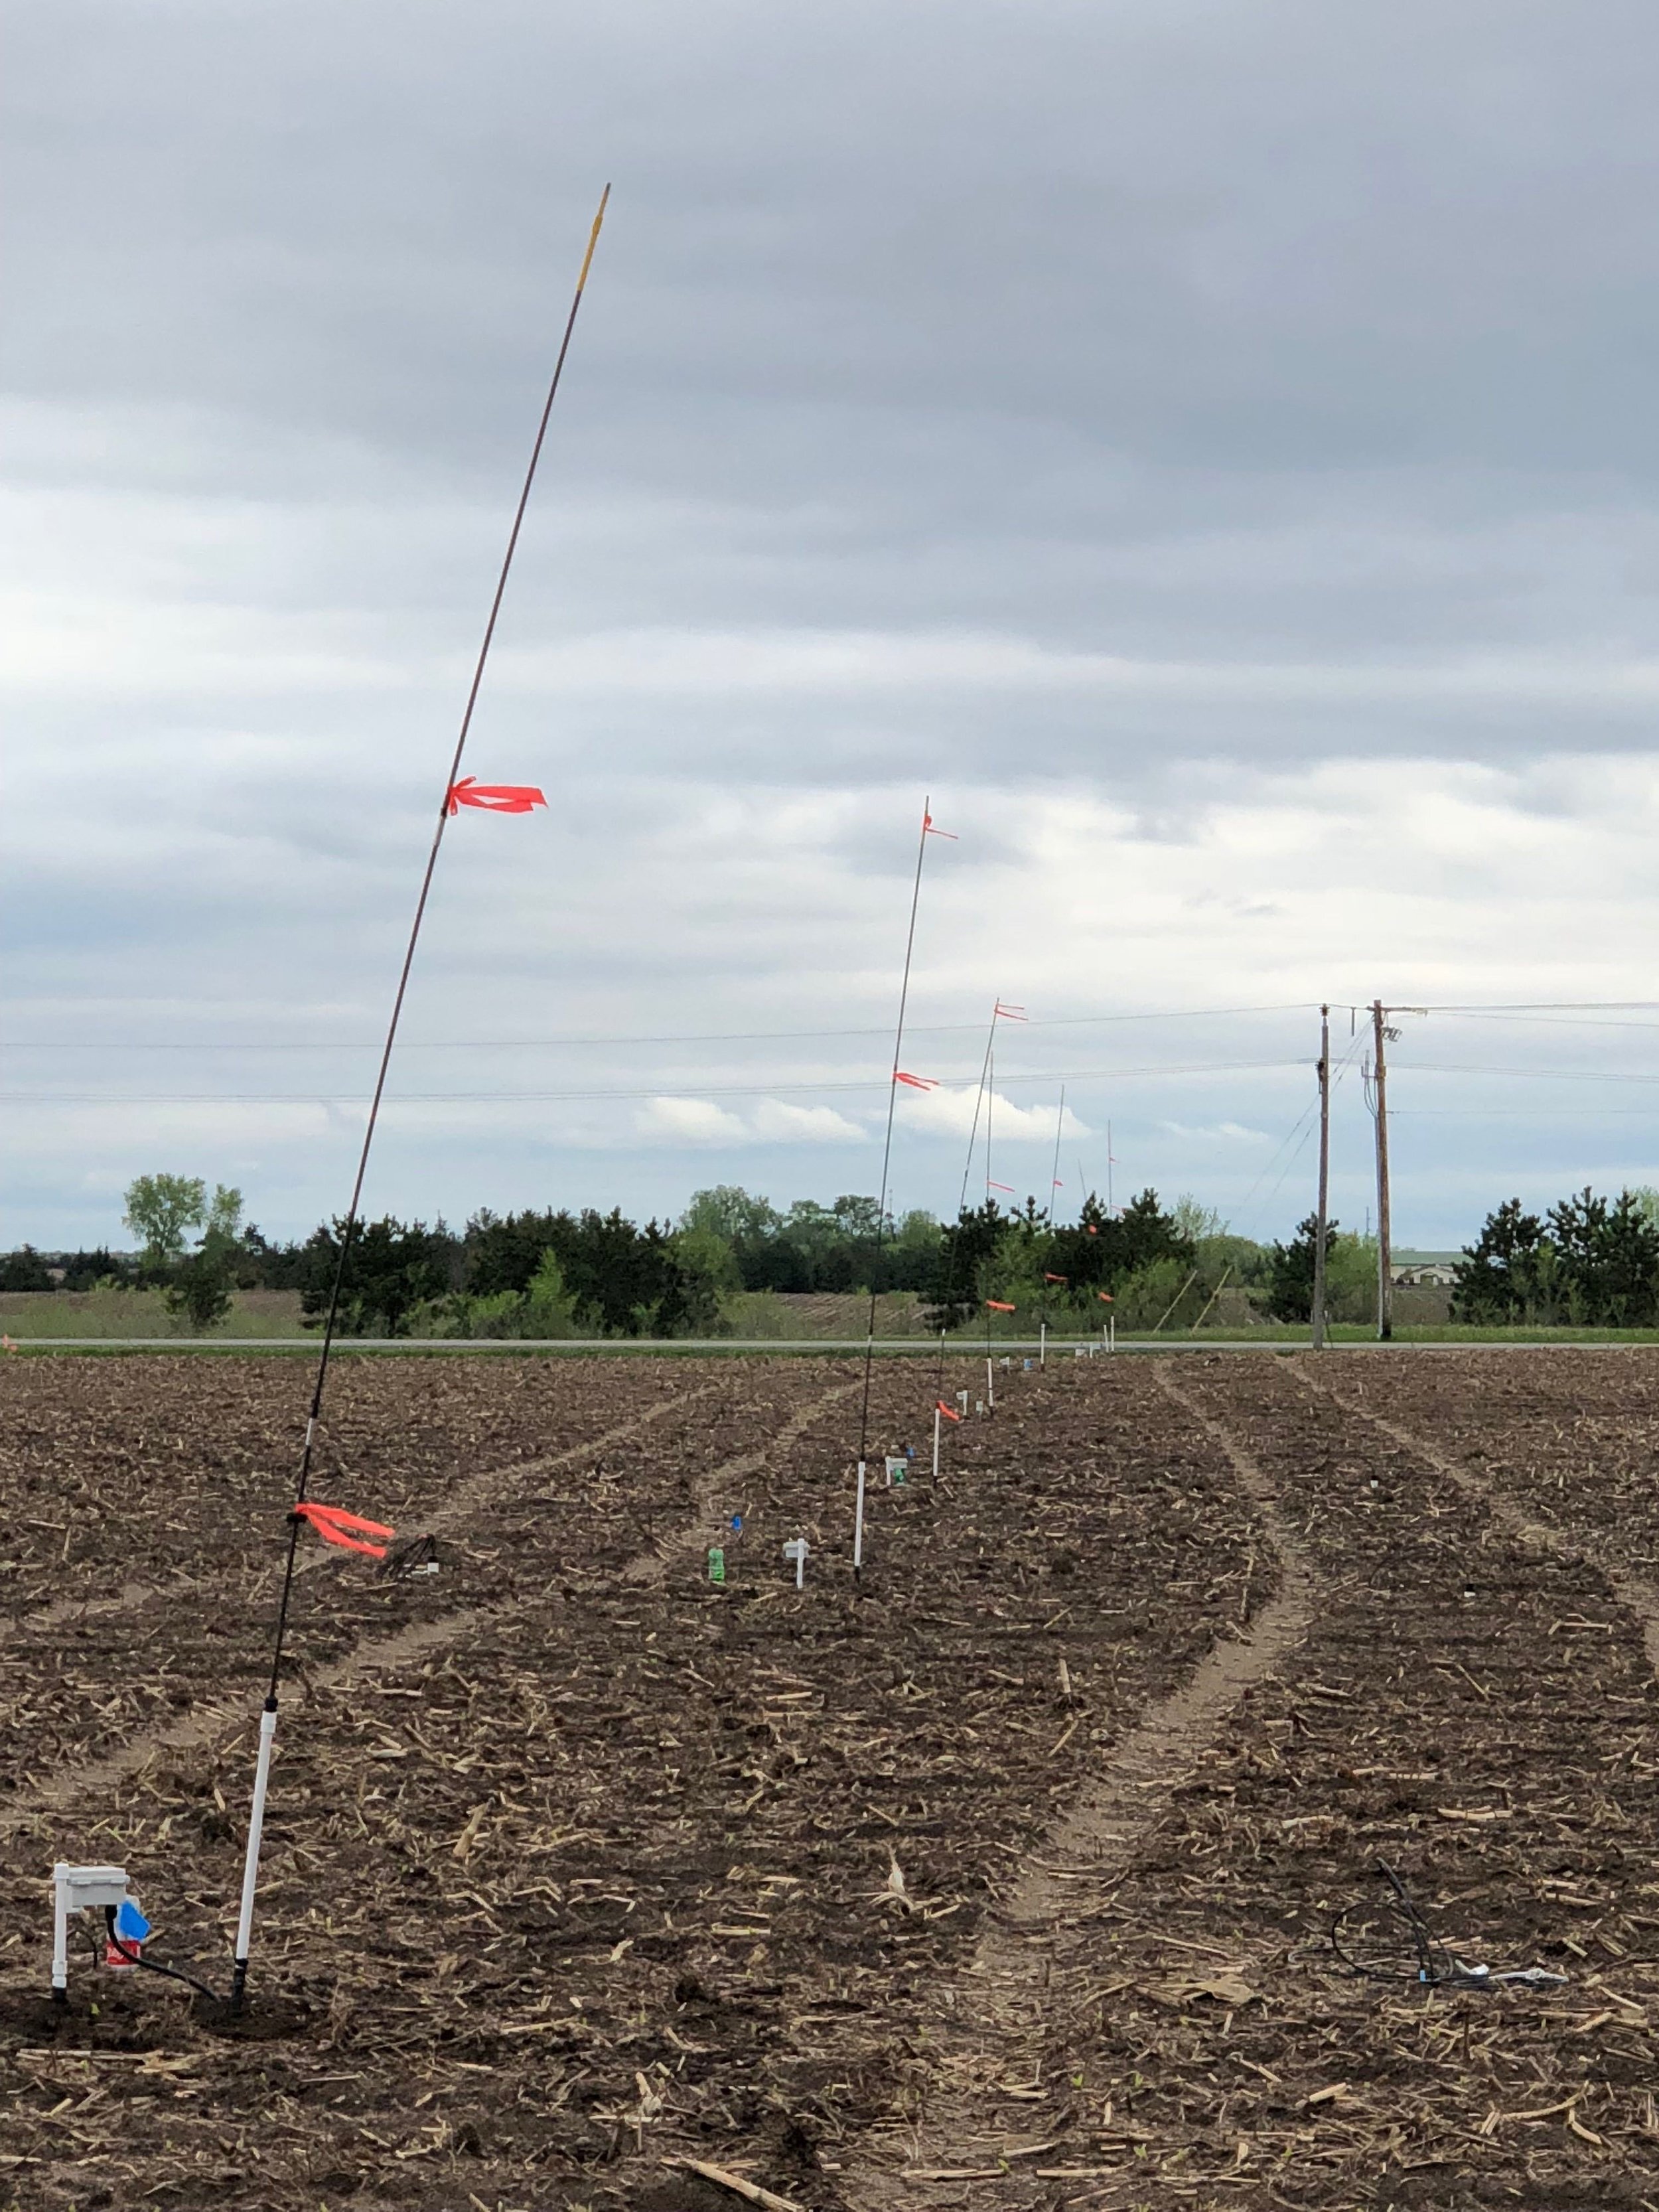
Don’t forget step 1: Proper Installation
Click the button below for an installation tutorial!
In all of the charts above, we have worked to explain sensor readings that we might not expect. It is important to keep in mind that all of these charts are shown after installation. Proper installation is key to trusting your sensor readings and using them to make irrigation decisions. If you ever find yourself questioning a reading, we recommend the following 4 methods to help verify that a sensor is recording correctly:
Dig a hole next to the probe to verify there are no air pockets around the sensors and to feel the soil directly to verify soil moisture
Pour water on the soil around the probe. You should see a significant response on your soil moisture charts
Reinstall the probe
Call on your local extension agent to see if they will help assist in testing a neutron probe by the sensor. Neutron probes are extremely accurate, but they are also too expensive for commercial use.
During Installation, make sure of the following:
Do not damage the crops near the sensor. Damaged crops will skew moisture readings in the surrounding soil.
Wet the sensor before installing it to acclimate it to the surrounding soil and improve response time.
Pour the slurry after the probe is installed, not before.
Avoid cracks in the ground near the PVC pipe. It is possible that if there is airspace between the PVC and the surrounding soil, water can run down the PVC and give inaccurate readings. One remedy for this is to place a 1.5 inch rubber gasket around the PVC pipe to block water from penetrating the airspace.
Consistently Monitor and Learn
Every region has different soil textures, water demands, water accessibility, irrigation demands and restrictions, costs to pump, crop varieties, weather conditions, growing seasons, and yield goals for their crops. Based on all of these factors, we must use our graph data on a relative scale to make decisions that will do best for our bottom line. The way to do this is to continuously monitor your sensors and act accordingly.
Cited Sources
https://www.nrcs.usda.gov/Internet/FSE_DOCUMENTS/nrcs142p2_053268.pdf
https://www.nrcs.usda.gov/Internet/FSE_DOCUMENTS/nrcs142p2_053289.pdf
http://www.allianceforwaterefficiency.org/Flood_Irrigation_Introduction.aspx
http://kbsgk12project.kbs.msu.edu/wp-content/uploads/2011/09/Soil-and-Water-Relationships.pdf
https://www.tankonyvtar.hu/hu/tartalom/tamop425/0032_talajtan/ch07.html